Dashboards, chats and metadata
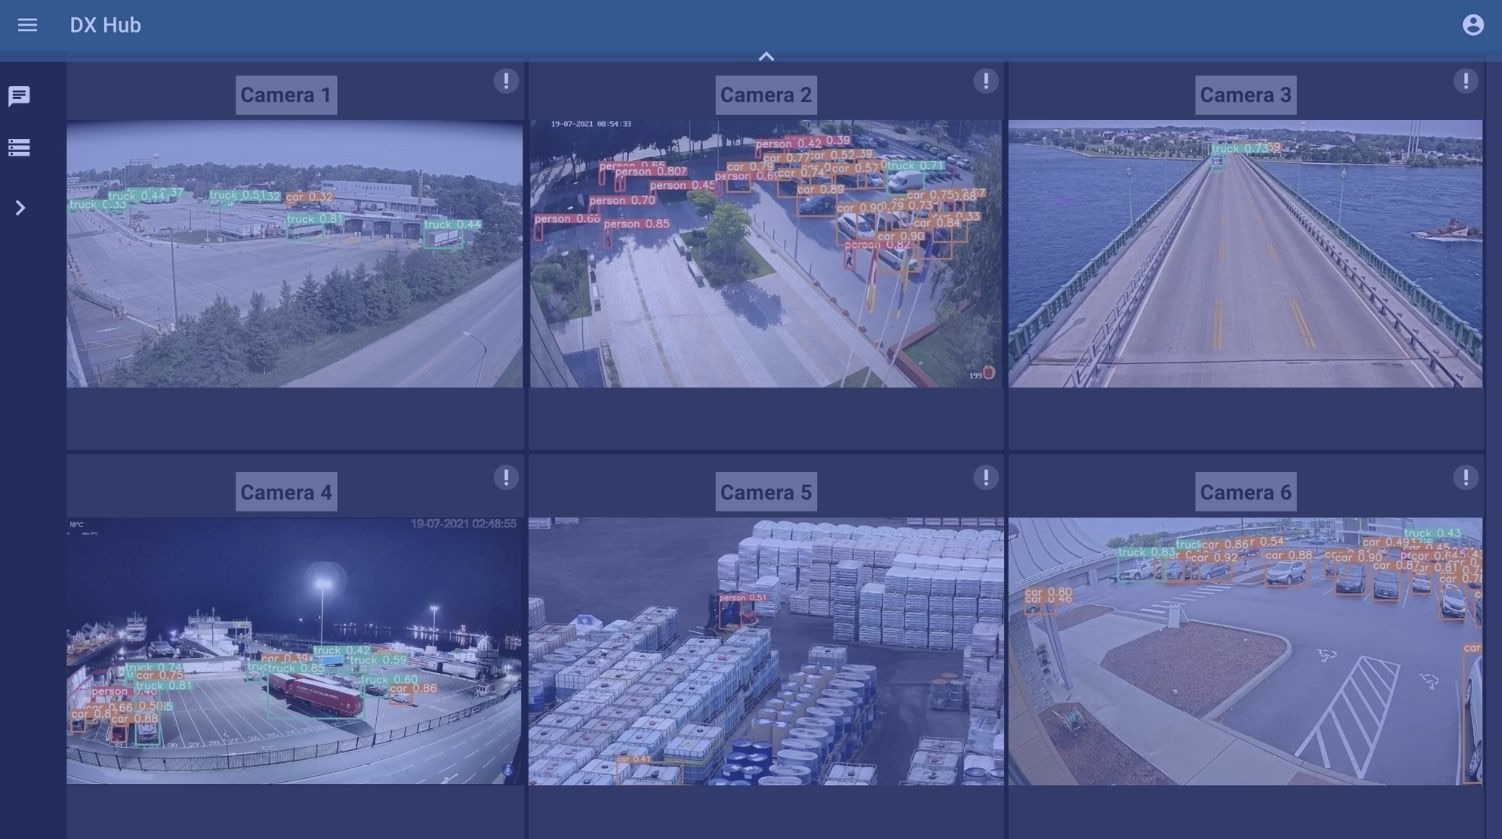
Dashboard is a convenient way of organizing client streams, monitoring and reacting to events. Streams in a dashboard are being processed on the server side with CV/ML models of client’s choice. The processed streams are broadcasted in realtime to user interface with the help of WebRTC technology. Along with video processing the metadata for each stream is generated, containing the text output of CV/ML models in terms of critical parameters being monitored, events and other high level data client needs. The metadata is transferred to user interface too with the help of highly scalable Kafka and Websockets, providing low latency of data delivery. The metadata can be displayed in a tracker for each video (e.g. for realtime parameters monitoring, like the number of event repetitions or a number of objects on the video, alerts when something happens etc) and logs (containing the feed of events for individual videos when they are opened separately or collectively for all of them when logs are opened in dashboard).
The chat is available from the dashboard, or when opening individual videos. They allow letting everybody who has access to a dashboard know when something is being spotted on one of the streams and react to the event.

Webrtc streaming and realtime processing
One of the main product features available to clients is the ability to add a stream (from CCTV or a webcam, for example), choose a CV/ML model for specific purposes, the parameters to monitor, and monitor the stream from the dashboard with realtime processing on the server side. The client is able to monitor the crucial parameters transmitted from CV/ML model in realtime with Kafka & Websockets and get alerts when some important event takes place.
CV/ML model is integrated into WebRTC streaming client based on highly modular, flexible and reliable Gstreamer, providing the best level of performance currently available.
The horizontal scalability of the system relies on Kubernetes and Kafka features. Vertical scalability can be achieved by optimizing the settings of CV/ML models and stream quality, providing the cost effectiveness clients need.
Historical view & smart timeline
Another feature of the product is the ability to review the streams or recorded videos in retrospective, having immediate access to events that were detected by CV/ML models. AI processing can do what human operators can’t – monitor multiple streams in realtime 24/7 and always have constant level of precision while human attention level can fluctuate over time and is not always reliable. For example, we have multiple CCTV streams added by a client and CV/ML models chosen for processing. The models process each frame, and when an event happens, or some parameter being monitored changes, the metadata is being generated and written into Kafka. The processed stream is being archived by chunks. Each archived video fragment is timestamped, as well as the events taking place and written into database.
The user can get into historical view section of the product, see the calendar with highlights indicating the dates when the streams were archived, click on the date and see the stream source with the recordings available. When clicking on the video file, the archived video is being played from the server and metadata with the events is highlighted on smart timeline. Hovering over highlights on smart timeline shows the description of the event. The user is immediately able to click any place on the timeline and review any event without spending much time reviewing archives manually. This can radically improve cost effectiveness of monitoring and enable the event awareness for the clients having terrabytes of already archived videos.

Server health tracking and statistics
Server maintenance and health monitoring is crucial for any business relying on automation of processes. Our product gives the ability for administrators and business owners to monitor the performance of the system and react when something goes wrong. The are several tools available for accomplishing this task:
– realtime health tracker, to get current state of server by request
– constant server health monitoring on backend
– slack alerts when any server is down
– stats showing server latency and uptime for the chosen period